|
Table of Contents
Benchmark Testing Environment 3
Communities and Label Propagations. 12
Functionality & Feature Testing and Comparison. 12
Overall User Experience & Visualization. 13
Usability & Maintainability. 13
Benchmark Testing Environment
- OS: RedHat 7.0
- Hardware/Cloud Setup:
- CPU: 8-core (Intel Xeon Gold 6148 2.4GHz, cache 28160KB)
- DRAM: 64GB
- Disks: 1TB SSD
- Networks: ACS Network (powered by Microsoft Azure Cloud Services)
- Cluster Setup: 3-instances
- Neo4j: Causal cluster
- Ultipa: HTAP cluster
- Software:
- Neo4j 4.07 Enterprise Edition
- Ultipa Server v2.1
- Ultipa KG v2.1
- Docker 19.0+
- Datasets:
- Alimama published dataset
- User transactional behaviour dataset (5.15M vertices, 100M edges)
- Vertex Entities: users and products.
- Edge Relationships: Page Views, Add-to-cart, Add-to-favorite, buy (purchase), etc.
- Average node degree ~= 20 (100M/5M)
Overview of Testing Plan
The testing includes side-by-side feature comparison and performance benchmarking between Neo4j v4.07 Enterprise edition and Ultipa v2.1 edition.
Based on retail banking needs, the testing will be primarily focusing on graph queries and graph computing performances:
- Meta-data related operations: CRUD operations on nodes and edges;
- Graph operations: Path, k-hop queries
- Graph algorithms: Benchmark against a few typical graph algorithms
For non-performance functionality related features, the following areas are tested:
- Support of visualization (GUI features)
- Support of high-availability and cluster deployment and management
- Support of extensibility
- Support of toolkits/toolchains
- Overall usability and user-experience.
Both systems are deployed in cluster setup:
- Neo4j Enterprise v4.07 with 3 instances causal cluster setup
- Ultipa v2.1 with 3 instances HTAP cluster setup
Note that, the bank’s on-premise cloud environment is supposedly ACS (Advanced Cloud Services) which is based on Microsoft Azure with some special network adaptations, think ACS for the bank’s private cloud as AWS for the public cloud. Due to Neo4j’s incompatibility with ACS, we had to resolve to use bare-metal cluster setup to conduct the following testing.
Benchmark Testing Contents
Functional Test
Meta-Data Operations
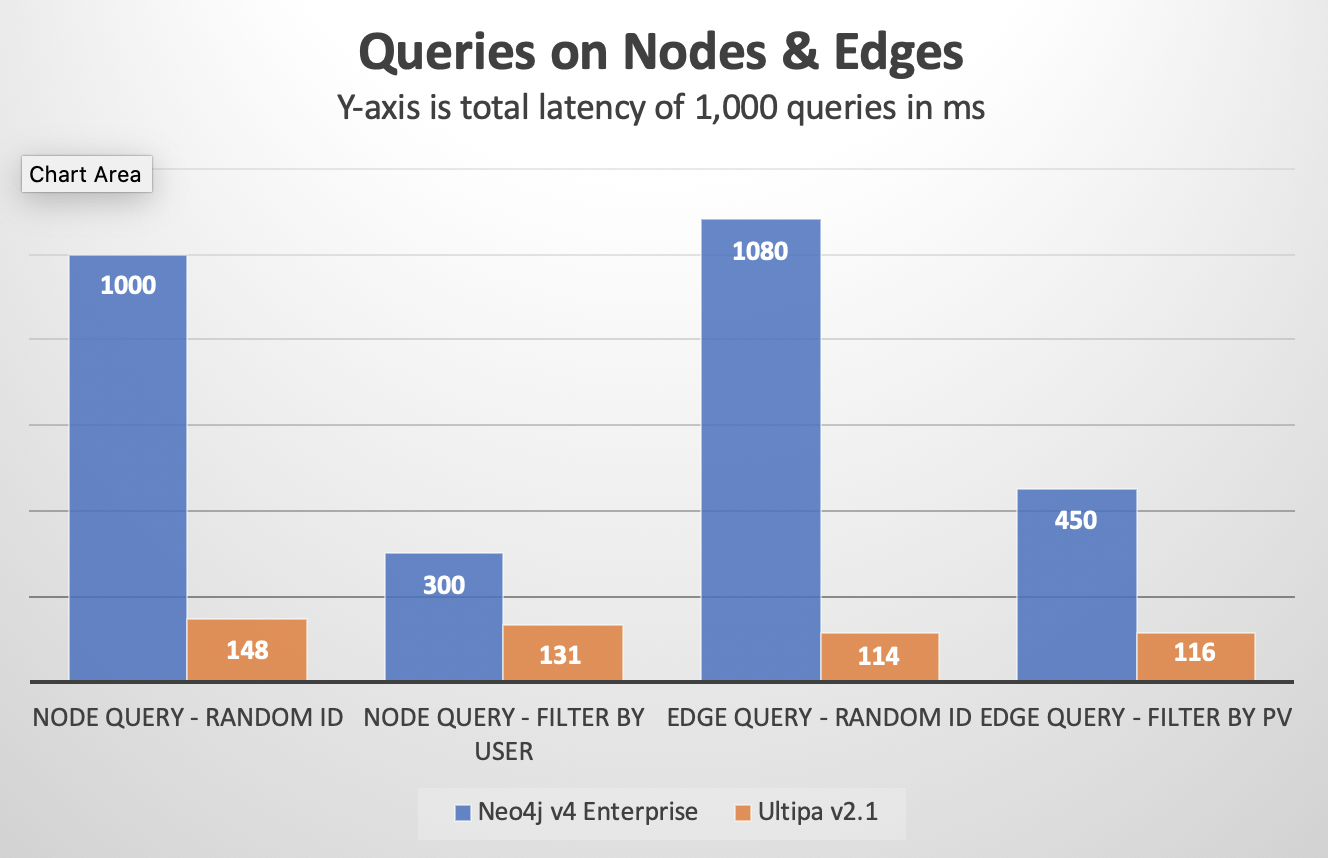
Node-Edge Queries
Randomized queries against nodes and edges by their IDs. The queries are repeated 1,000 times for each type, total time and average individual query time are counted. If TPS (transactions per second) is counted, it’s also recorded.
Note that all numbers below are in milliseconds (ms), unless otherwise annotated.
Neo4j testing results:
|
Meta Query Testing Items |
Avg. Latency (ms) |
Total Latency (in ms) |
TPS |
|
Node Query - Random ID |
1 |
1000 |
|
|
Node Query – by User |
0.3 |
300 |
|
|
Edge Query – Random ID |
1.08 |
1080 |
|
|
Edge Query – by PV |
0.45 |
450 |
|
Ultipa testing results:
|
Meta Query Testing Items |
Avg. Latency (ms) |
Total Latency (in ms) |
TPS |
|
Node Query - Random ID |
0.148 |
148 |
6735 |
|
Node Query – by User |
0.131 |
131 |
7645 |
|
Edge Query – Random ID |
0.115 |
115 |
8714 |
|
Edge Query – by PV |
0.116 |
116 |
8588 |
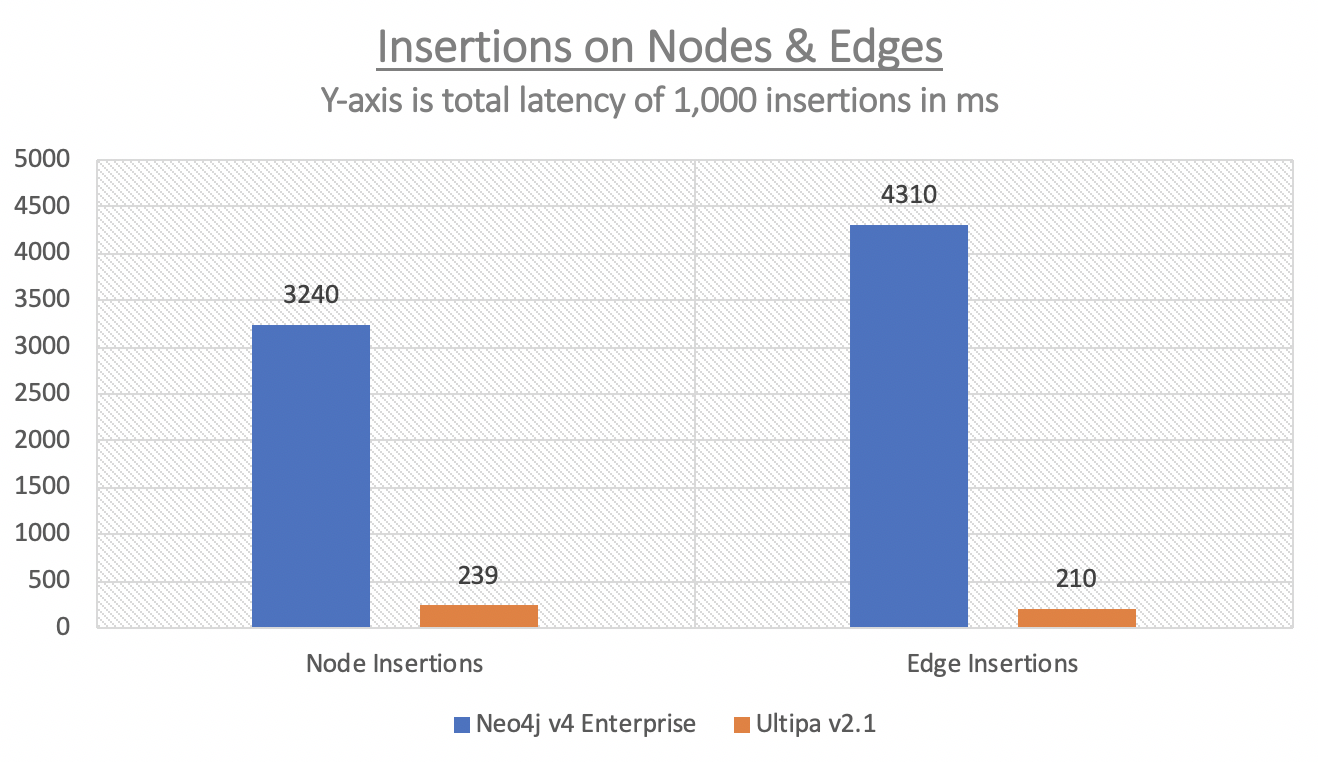
Node-Edge Insertion
Randomly inserting 1,000 nodes and 1,000 edges. Count the total time and average time of per insertion. All operations latencies are counted in milliseconds (ms).
Neo4j testing results:
|
Insertion Testing Items |
Avg. Latency (ms) |
Total Latency (in ms) |
TPS |
|
Node Insertion |
3.24 |
3240 |
|
|
Edge Insertion |
4.31 |
4310 |
|
Ultipa testing results:
|
Insertion Testing Items |
Avg. Latency (ms) |
Total Latency (in ms) |
TPS |
|
Node Insertion |
0.24 |
240 |
4178 |
|
Edge Insertion |
0.21 |
210 |
4741 |
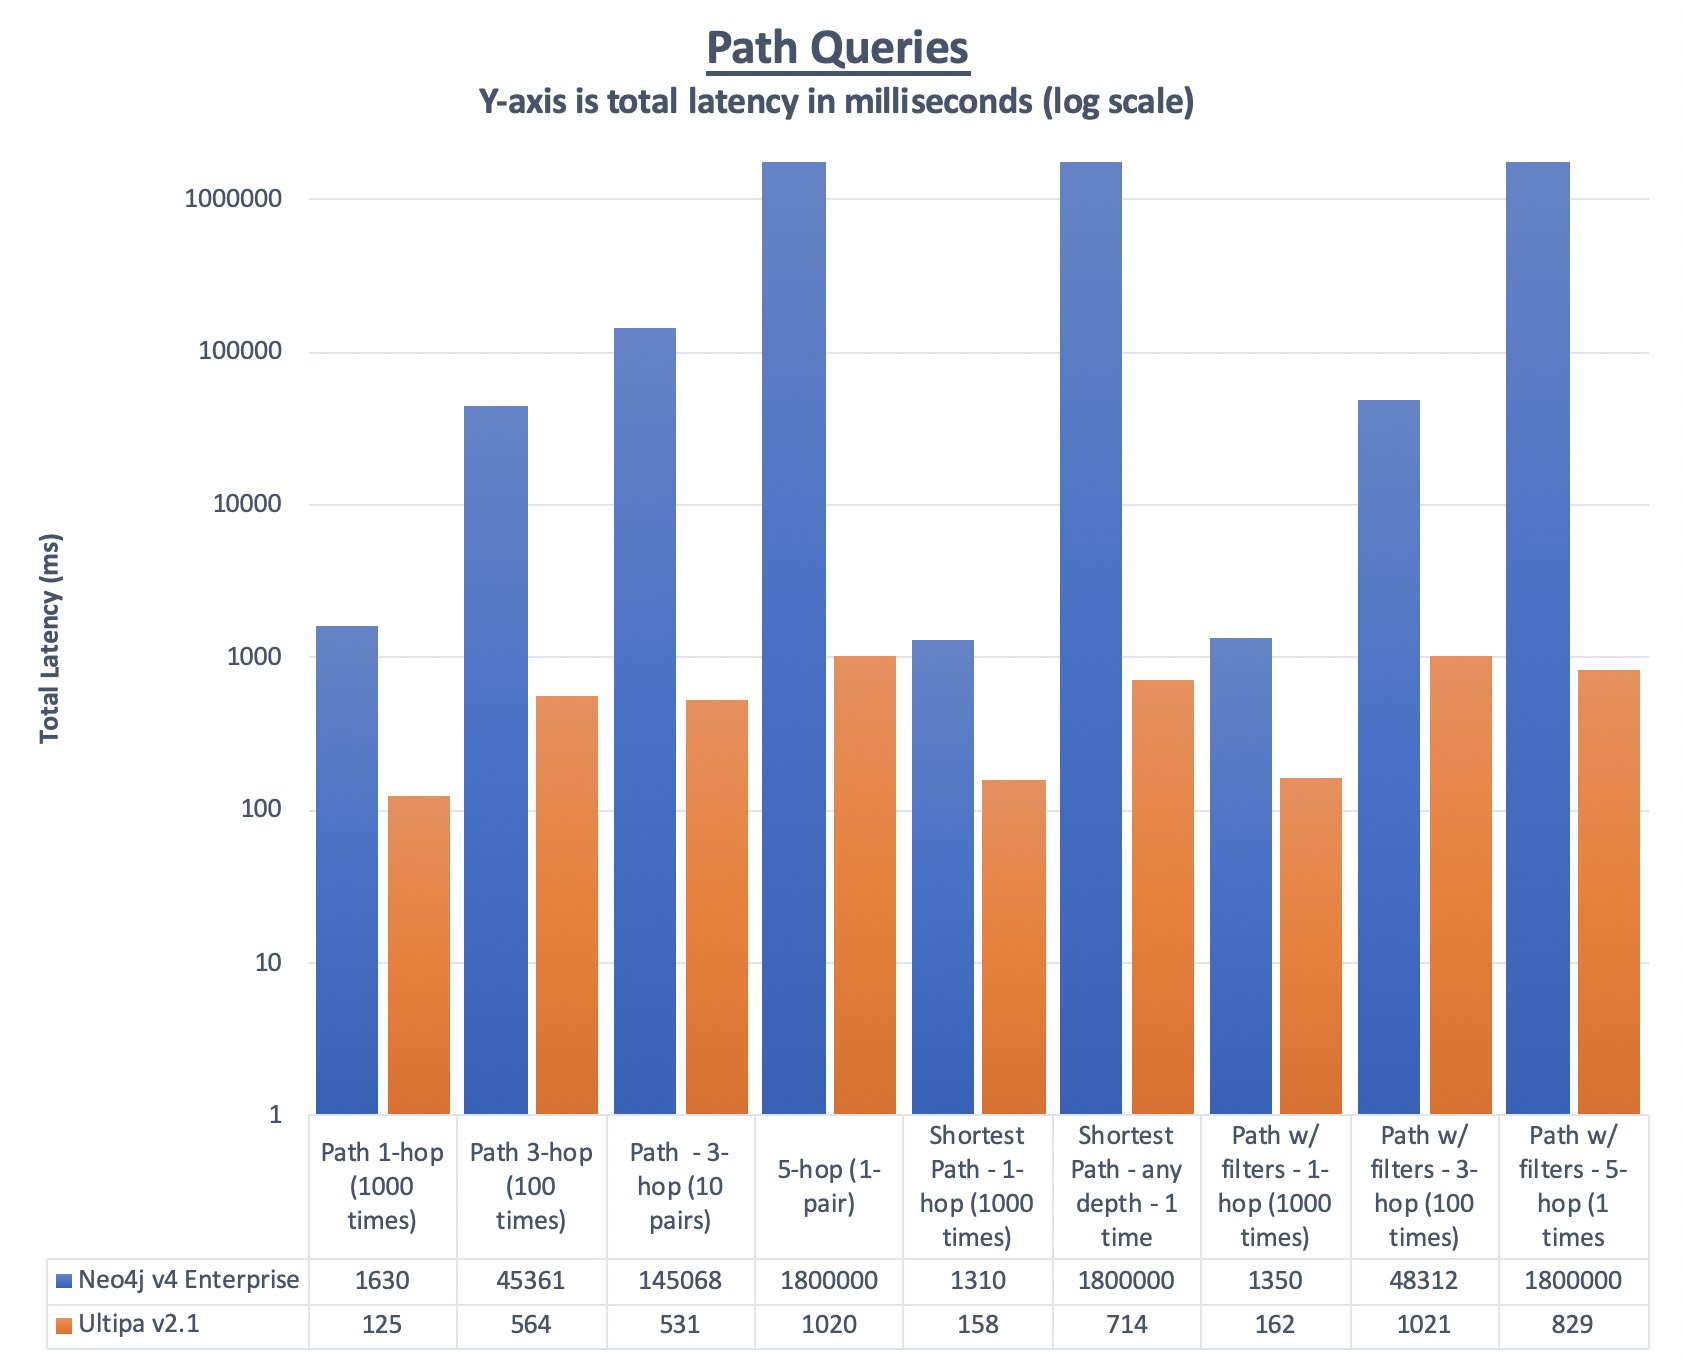
Path Queries
Randomly query against N pairs of nodes, the search depths are 1-hop, 3-hop or 5-hop.
When searching with filters, using the PV attribute tagged on each edge (relationship).
For 1 and 3-hop path queries, random ID pairs are used for testing.
For 5-hop queries, due to this testing dataset’s topology characteristics, to ensure results are available for easier latency comparison, the following pairs of IDs are pre-selected:
- u602926,p111765
- p111765,u728516
- p3276990,u857323
- u965769,p2724538
- u602926,p4755938
- p1944109,u532914
- u900245,p242356
- u88211,p1364561 (hotspot to hotspot)
To understand the testing dataset’s “challenge”, let’s use the following simple math, based on average node degree, which stands at 20:
- 1-hop: average edges to filter or traverse: 20
- 2-hop: average edges to filter or traverse: 400
- 3-hop: average edges to filter or traverse: 8,000
- 4-hop: average edges to filter or traverse: 160,000
- 5-hop: average edges to filter or traverse: 3,200,000
Given hotspot nodes, they are usually orders of magnitudes more heavily connected, therefore making traversing or querying against such nodes way more challenging. It’s highly probable to see that when counting any node’s neighbors that are 4 or 5-hop away, hotspot nodes will be encountered! Due to this challenge, we therefore limit the 5-hop deep path query to be only 1, and latency to be within 1800 seconds, for Neo4j to make sure we do NOT have to wait extensively long for results. The same types of 5-hop deep path queries were conducted 7 times by Ultipa to see how consistent its performance was.
Neo4j testing results
|
Path Query Testing Items |
Avg. Latency (ms) |
Total Latency (in ms) |
TPS |
|
Path – 1-hop (1,000 times) |
1.63 |
1630 |
|
|
Path – 3-hop (100 times) |
454 |
45361 |
|
|
Path – 3 hop (10 pairs) |
14.5s |
145068 |
|
|
Path – 5-hop (1 pair) |
Not-Returned in Time |
>1800s |
|
|
Shortest Path – 1 hop (1,000 times) |
1.31 |
1310 |
|
|
Shortest Path – any depth (1 pair) |
Not-Returned in Time |
>1800s |
|
|
Path w/ filters – 1-hop (1,000 times) |
1.35 |
1350 |
|
|
Path w/ filters – 3-hop (100 times) |
483 |
48312 |
|
|
Path w/ filters – 5-hop (1 pair) |
Not-Returned in Time |
>1800s |
|
Note that for path queries, a 30-min cap is set for each query, if the query does NOT return within 30-min, the query will be killed. Given Neo4j enough time, say, a few hours, it may eventually return with results.
Ultipa testing results:
|
Path Query Testing Items |
Avg. Latency (ms) |
Total Latency (in ms) |
TPS |
|
Path – 1-hop (1,000 times) |
0.13 |
125 |
7969 |
|
Path – 3-hop (100 times) |
5.65 |
565 |
177 |
|
Path – 3-hop (10 pairs) |
53 |
531 |
20 |
|
Path – 5-hop (7 pairs) |
1020 |
7166 |
1 |
|
Shortest Path – 1 hop (1,000 times) |
0.158 |
158 |
6310 |
|
Shortest Path – 3 hop (100 times) |
7.14 |
714 |
140 |
|
Path w/ filters – 1-hop (1,000 times) |
0.16 |
162 |
6154 |
|
Path w/ filters – 3-hop (100 times) |
10.21 |
1021 |
98 |
|
Path w/ filters – 5-hop (7 pairs) |
829 |
5807 |
1 |
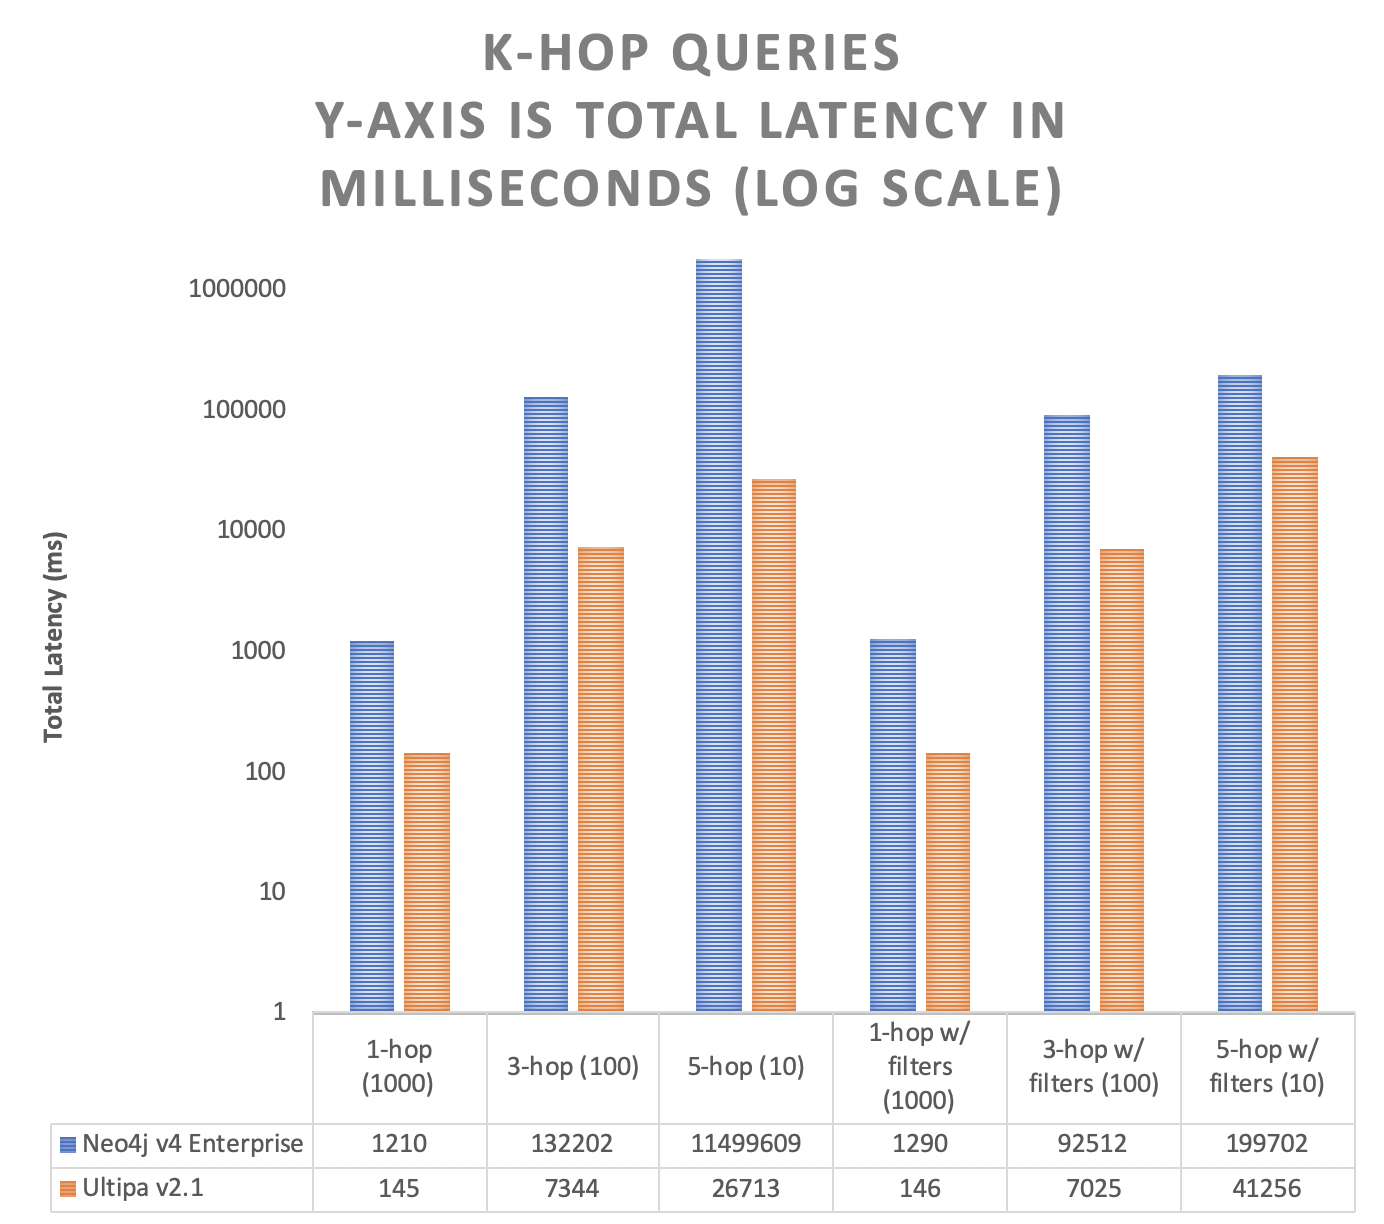
K-hop Neighbor Queries
The K-hop testing is to calculate the number of neighbors of a certain starting node that are exactly K-hop away, given certain filtering rules.
Note the definition of K-hop is that if a node appears to be the starting node’s k-hop neighbor, their shortest path in-between must be of K hops in length.
The filtering condition is by edge’s PV attribute. All queries are randomized and repeated 1,000 or 100 times, given the query depth.
Neo4j testing results:
|
K-hop Testing Items |
Avg. Latency (ms) |
Total Latency (in ms) |
TPS |
|
Random 1-hop (1,000 times) |
1.2 |
1210 |
|
|
Random 3-hop (100 times) |
1300 |
132202 |
|
|
Random 5-hop (10 times) |
1150s |
11500s |
|
|
Random 1-hop w/ filtering (1,000 times) |
1.3 |
1300 |
|
|
Random 3-hop w/ filtering (100 times) |
925 |
92500 |
|
|
Random 5-hop w/ filtering (10 times) |
19900 |
199000 |
|
Ultipa testing results:
|
K-hop Testing Items |
Avg. Latency (ms) |
Total Latency (in ms) |
TPS |
|
Random 1-hop (1,000 times) |
0.145 |
145 |
6897 |
|
Random 3-hop (100 times) |
73.44 |
7344 |
13 |
|
Random 5-hop (10 times) |
2671 |
26710 |
0.4 |
|
Random 1-hop w/ filtering (1,000 times) |
0.146 |
146 |
6869 |
|
Random 3-hop w/ filtering (100 times) |
70.25 |
7025 |
14 |
|
Random 5-hop w/ filtering (10 times) |
4126 |
41256 |
0.24 |
Graph Algorithms
Algorithms testing are conducted around the following areas:
- Basic graph algorithms, such as degrees
- Similarities, such as Jaccard
- Communities, such as Louvain and label propagations
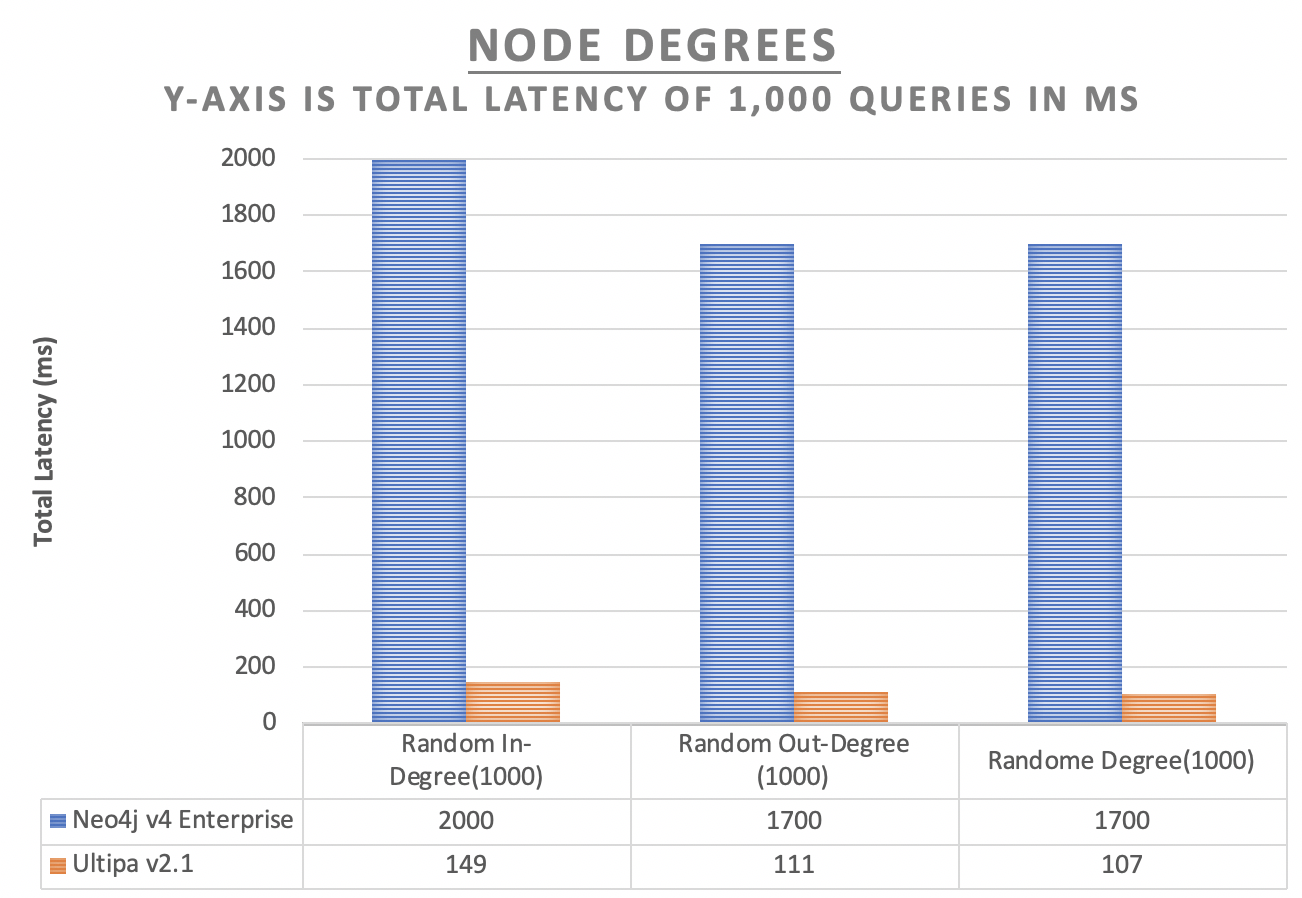
Degrees
In-degree, out-degree or degrees are commonly used basic graph algorithms, the testing are conducted to measure Neo4j and Ultipa’s performance.
Neo4j testing results:
|
Degree Testing Items |
Avg. Latency (ms) |
Total Latency (in ms) |
TPS |
|
Random Node In-Degree (1,000 times) |
2 |
2000 |
|
|
Random Node Out-Degree (1,000 times) |
1.7 |
1700 |
|
|
Random Node Degree (1,000 times) |
1.7 |
1700 |
|
Ultipa testing results:
|
Degree Testing Items |
Avg. Latency (ms) |
Total Latency (in ms) |
TPS |
|
Random Node In-Degree (1,000 times) |
0.149 |
149 |
6727 |
|
Random Node Out-Degree (1,000 times) |
0.111 |
111 |
9029 |
|
Random Node Degree (1,000 times) |
0.107 |
107 |
9331 |
Similarities
Jaccard Similarities are used in the following benchmarks.
There are 2 types of Jaccard Similarities:
- Node-to-Node Similarity
- Top-10 Most Similar Nodes (to a certain node)
Neo4j testing results:
|
Jaccard Testing Items |
Avg. Latency (ms) |
Total Latency (in ms) |
TPS |
|
Random 1,000 pair of nodes |
4.49 |
4490 |
|
|
Random 1,000 nodes, top-10 for each node |
Not-Returned |
>1800s |
|
Ultipa testing results:
|
Jaccard Testing Items |
Avg. Latency (ms) |
Total Latency (in ms) |
TPS |
|
Random 1,000 pair of nodes |
0.124 |
124 |
8034 |
|
Random 1,000 nodes, top-10 for each node |
0.110 |
110 |
9096 |
Communities and Label Propagations
LPA (Label Propagation Algorithm) and Louvain are two commonly used graph algorithms, though Louvain is considerably more sophisticated than LPA, the benchmark results are captured in the following table:
|
Testing Items |
Neo4j Computing Time |
Ultipa Computing Time (in seconds) |
|
LPA |
Not Returned |
45s |
|
Louvain Community Detection (loops=20, min_modularity_increase=0.0001) |
Failed to Create Projection |
180s |
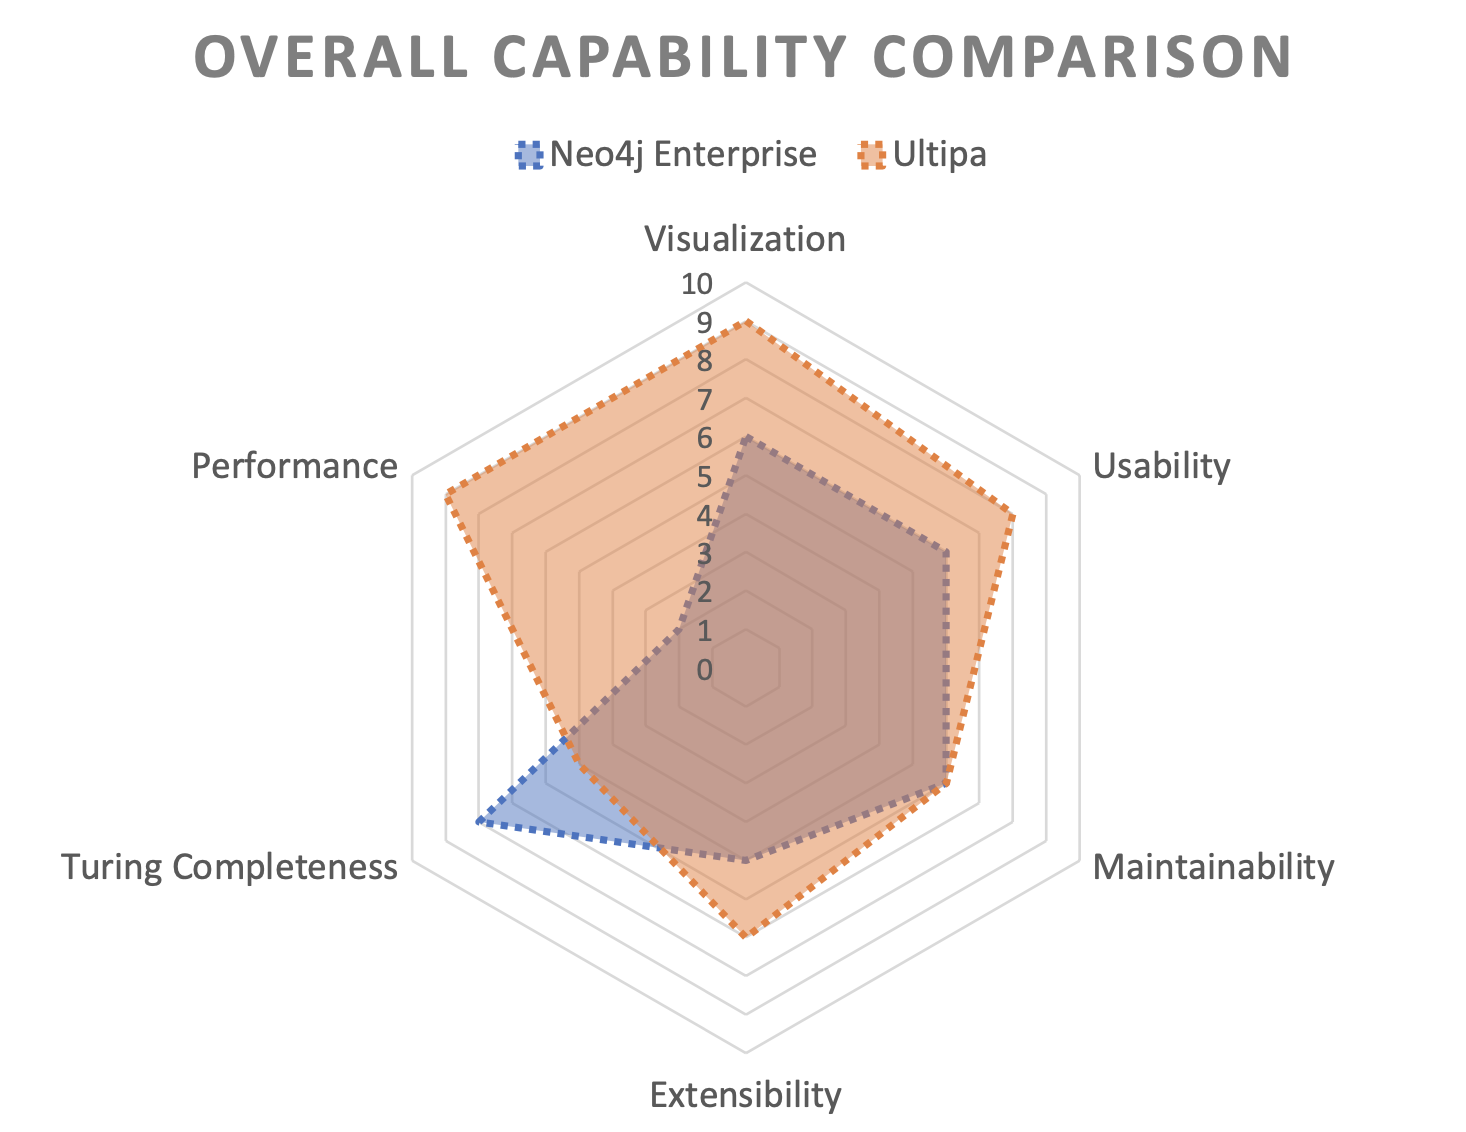
Functionality & Feature Testing and Comparison
The following key features are compared:
- Usability & Maintainability
- Visualization & User-Experience
- Extensibility
Overall User Experience & Visualization
|
Feature Components |
Neo4j / Ultipa (Support or Not) |
Remarks |
|
Visualied Graph Query |
Yes (2D) / Yes (2D/3D) |
Neo4j supports 2D mode only. Ultipa supports 2D/3D modes. |
|
Visualized Graph Editing |
No / Yes |
Neo4j doesn’t allow visual editing. Ultipa supports visual editing. |
|
Visualized Data Creation |
No / Yes |
ditto |
|
Visualized Data Deletion |
No / Yes |
ditto |
|
Visualized Incremetal Query |
No / Yes |
Incremental operations based on existing results. |
|
Visualized Algorithm Execution |
No / Yes |
Neo4j doesn’t support. Ultipa supports algorithm execution, status checking, stop, etc. |
|
Statistical Information |
Yes / Yes |
Both support this. Ultipa supports system resources monitoring over Ultipa Manager (the visual/graphical front-end of Ultipa Server). |
|
Visualized User and Privilege Management |
No / Yes |
Ultipa’s support of visualized privilege management also includes graphset, system-level access, policy and role-based definition and management. |
|
Visualized Services – Rapid Deployment |
Yes / Yes |
Support of 1-click Docker-based deployment. |
Usability & Maintainability
|
Feature Components |
Neo4j / Ultipa (Support or Not) |
Remarks |
|
Persistence Storage |
Yes / Yes |
Both support native graph storage |
|
Rapid Data Import Tools |
Yes / Yes |
Both provide import/export tools. |
|
LBS |
Yes / Yes |
Both suport LBS. Additionally, Ultipa allows algorithmic tasks allocation to instances that are defined as algo-instance! |
|
Graph Query Language |
Yes / Yes |
Cypher is a SQL-like operational language, it serves Neo4j well.
UQL is graphical query language, it’s natural to human way of thinking, and easier to coding and requires little cognitive loading. |
|
High Availability |
Yes / Yes |
Both support multiple-node high-availability and cluster-wide data-consistency. |
|
Technical Support |
Yes / Yes |
|
Extensibility
|
Feature Components |
Neo4j / Ultipa (Support or Not) |
Remarks |
|
Java SDK |
Yes / Yes |
|
|
Python SDK |
Yes / Yes |
|
|
Restful API |
No / Yes |
Restful API is complimentary to language-specific SDKs. |
|
Visualization Functionality Extensibility |
No / Yes |
Ultipa supports customization and extension to Ultipa Manager. Secondary development components can be uploaded and re-edited. |
|
Algorithm Extensibility |
Via GDS / Yes |
Neo4j algorithms are packed in GDS, customization may be more challenging.
Ultipa supports hot pluggable algorithm installations, and algorithm customizations for high-value scenarios. |
|
Core Team Tech Support |
Probability Not / Yes |
Ultipa team is potentially more agile and willing to offer core engineering team support. |
Summaries and Findings
To recap:
- Performance-wise: Neo4j, in general, is 10 times slower than Ultipa;
- When search depth is beyond 3-hop, the performance gap is enlarged;
- When the query complexity is elevated, the performance gap is also widened.
- For graph algorithms, Ultipa shows a similar performance edge over Neo4j.
Pros & Cons:
- Neo4j community is much bigger, and it's primarily OLAP oriented.
- Ultipa is relatively new to the market, and it's HTAP (OLTP+OLAP) focused.
- For performance/TP scenarios, Ultipa should be considered with priority.
- For simple and small datasets, there are no significant differences between Neo4j and Ultipa.
- For large and sophisticated datasets and data modeling, Ultipa has a clear advantage.
- Ultipa also gains clear advantages over Neo4j from a visualization perspective.